Loading...


Life expectancy at 65
Introduction
This section explores life expectancy at 65 across three main measures:Life expectancy at 65 - This indicator gives context to healthy life expectancy figures by providing information on the estimated length of life. The two indicators are extremely important summary measures of mortality and morbidity. They complement the supporting indicators by showing the overall trends in major population health measures, setting the context in which local authorities can assess the other indicators and identify the drivers of life expectancy and healthy life expectancy.
Healthy life expectancy at 65 - This indicator provides an important summary measure of the mortality and morbidity in those aged 65 years and over. Healthy life expectancy shows the years a person can expect to live in good health (rather than with a disability or in poor health).
Disability-free life expectancy at 65 - This indicator is an important summary measure of health and has implications for: quality of life; fitness for work given increases in the State Pension age; personal finances; social connections and contributions; health and care services; and the wider economy. it is an estimate of the number of years a person aged 65 years would expect to live without a long lasting physical or mental health condition or disability limiting their ability to carry out day to day activities.
Data Overview
Life Expectancy at 65
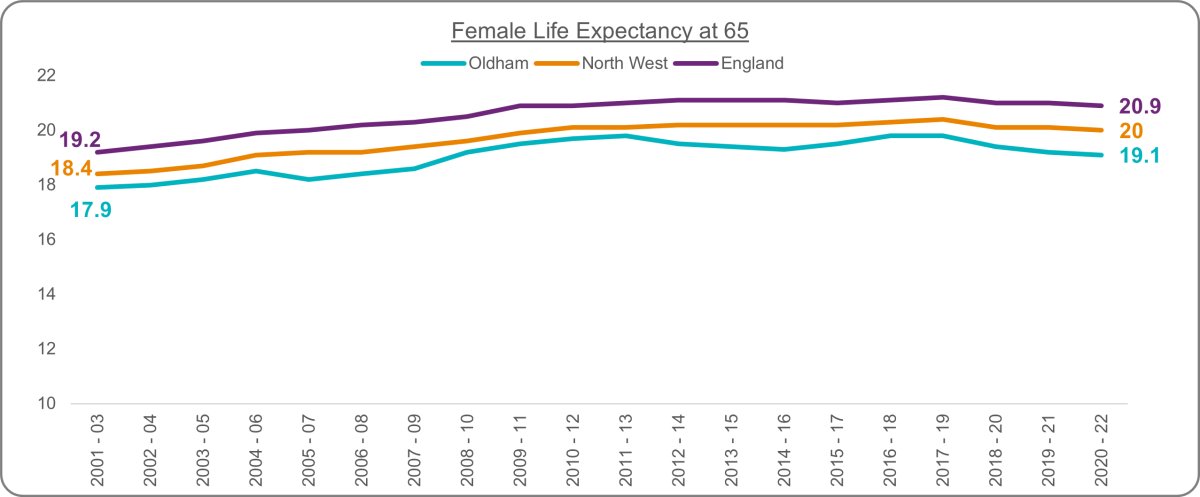
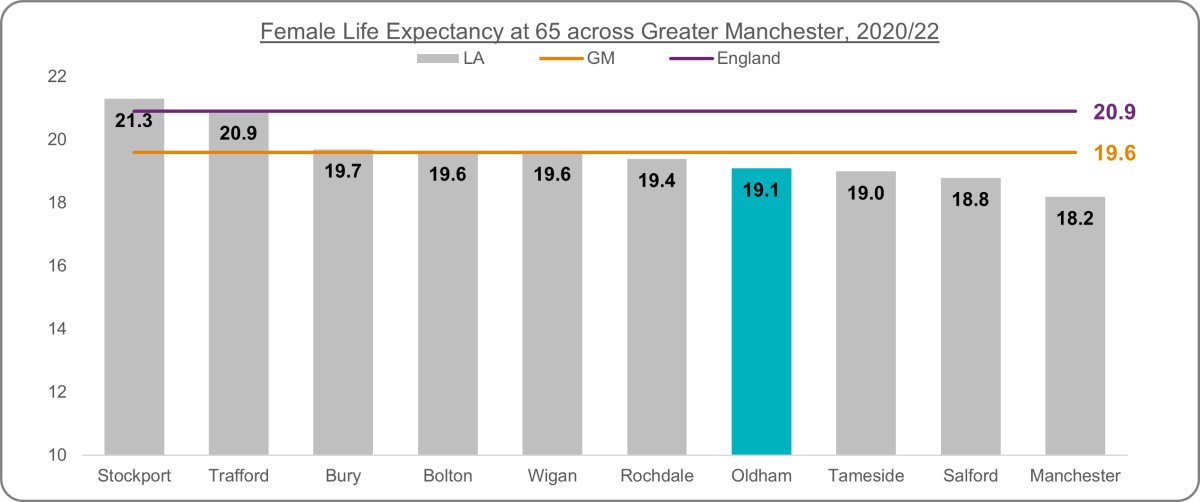
Life Expectancy at 65 reflects the average number of years a person would expect to live based on contemporary mortality rates. For a particular area and time period, it is an estimate of the average number of years at age 65 a person would survive if he or she experienced the age specific mortality rates for that area and time period throughout his or her life after that age. Figures reflect mortality among those living in an area in each time period, rather than what will be experienced throughout life among those born in the area. The figures are not therefore the number of years a baby born in the area could actually expect to live, both because the mortality rates of the area are likely to change in the future and because many of those born in the area will live elsewhere for at least some part of their lives [1].Oldham's latest female life expectancy at age 65 is 19.1 years. This is 0.9 years lower than the North West average and 1.8 years lower than the England average. Oldham's rate ranks 4th lowest across Greater Manchester and 4th lowest amongst CIPFA nearest neighbours. Between 2001/03 and 2020/22 Oldham has seen a 6.7% increase, lower than the increases seen regionally (+8.7%) and nationally (+8.9%). Female life expectancy at 65 saw a peak in rates in 2017/19 across all geographies and has seen decreased by 3.5% in Oldham, 2% across the North West and 1% nationally.
Figure 1: Female life expectancy at 65 trend
 Source: ONS
Figure 2: Female life expectancy at age 65 across Greater Manchester
 Source: ONS
Figure 3: Female life expectancy at age 65 across CIPFA nearest neighbours
 Source: ONS
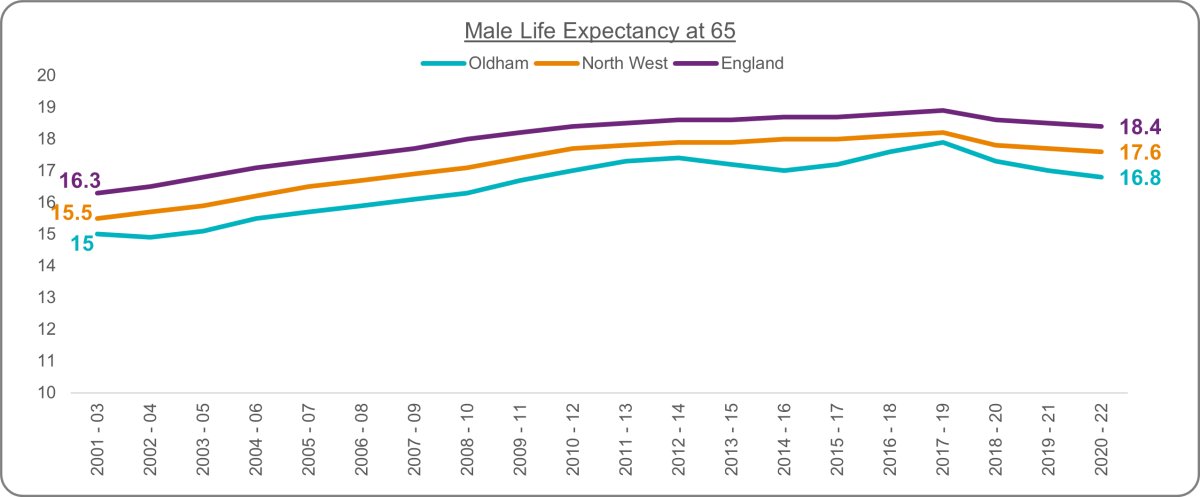
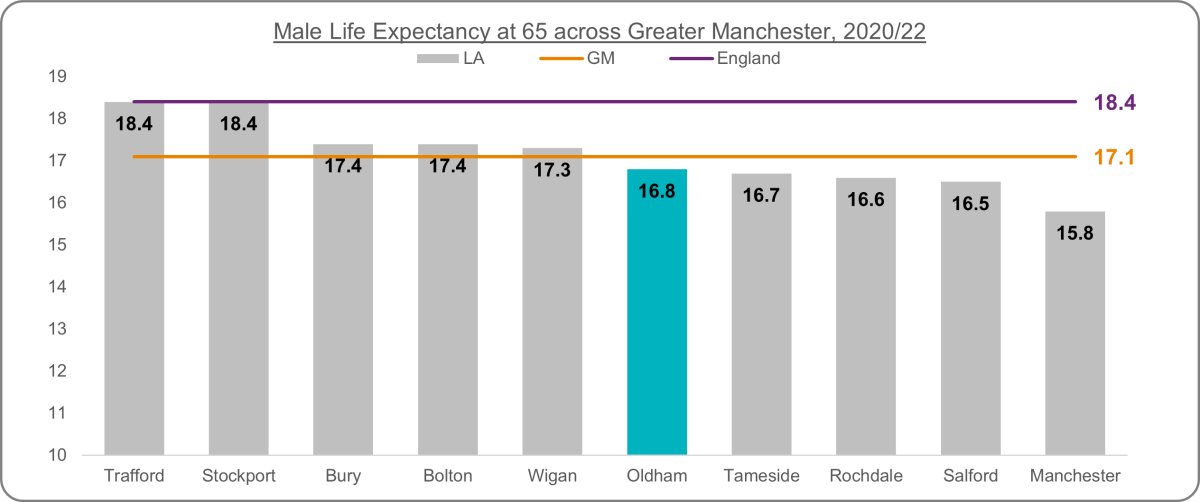
Oldham's latest male life expectancy at age 65 is 16.8 years. This is 0.8 years lower than the North West average and 1.6 years lower than the England average. Oldham's rate ranks 5th lowest across Greater Manchester and 6th lowest amongst CIPFA nearest neighbours. Between 2001/03 and 2020/22 Oldham has seen a 12% increase, similar to the increases seen regionally (+13.5%) and nationally (+12.9%). Male life expectancy at 65 saw a peak in rates in 2017/19 across all geographies and has since decreased by 6% in Oldham, 3% across the North West and 3% nationally.
Figure 4: Male life expectancy at 65 trend
 Source: ONS
Figure 5: Male life expectancy at 65 across Greater Manchester
 Source: ONS
Figure 6: Male life expectancy at 65 across CIPFA nearest neighbours
 Source: ONS
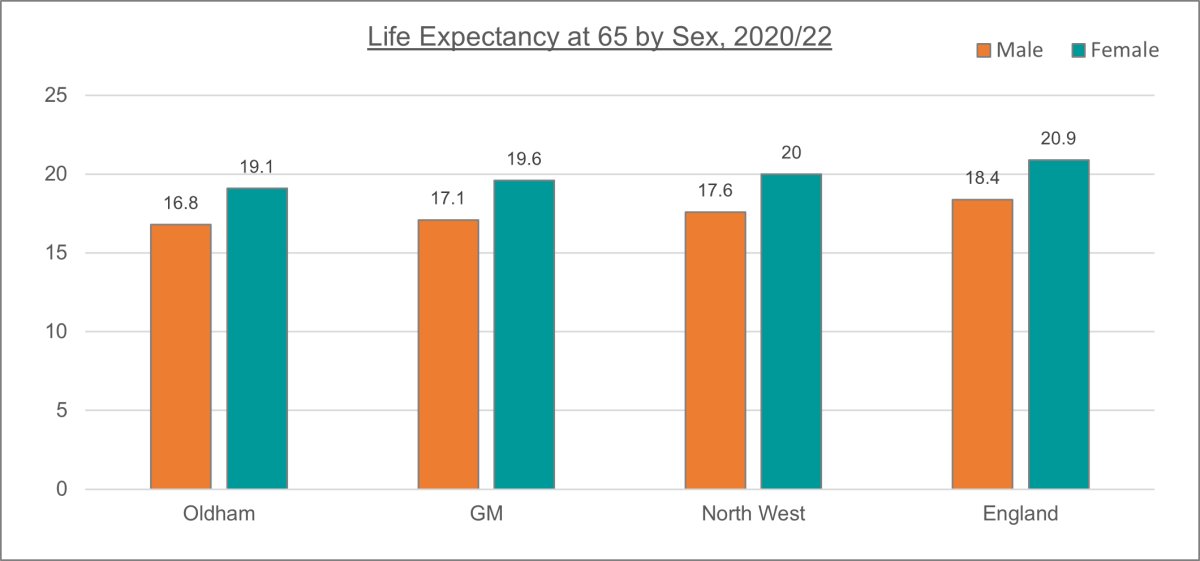
Male life expectancy at 65 has seen greater increases than for females between 2001/03 and 2020/22 and has seen less of a decrease in rate since the 2017/19 peak. In the most recent data, the gap in life expectancy at 65 between males and females is 2.3 years in Oldham. The gap for the North West is 2.4 years and England slightly greater at 2.5 years.
Figure 7: Life expectancy at age 65 by sex
 Source: ONS
Healthy Life Expectancy at 65
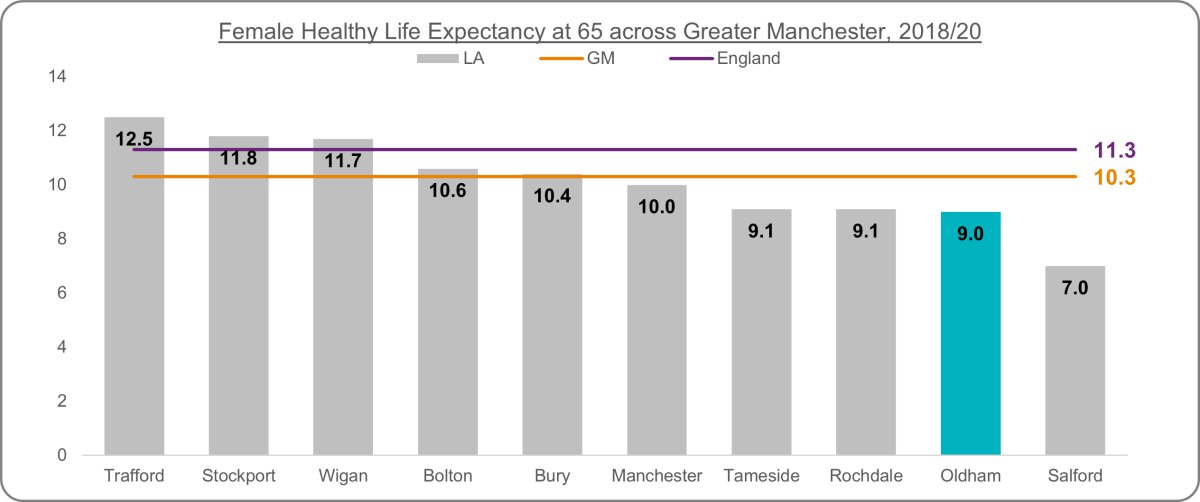
Healthy life expectancy shows the years a person can expect to live in good health (rather than with a disability or in poor health). The prevalence of good health is derived from responses to a survey question on general health. For a particular area and time period, it is an estimate of the average number of years a person aged 65 years would live in good general health if he or she experienced the age specific mortality rates and prevalence of good health for that area and time period throughout his or her remaining life. Figures are calculated from deaths from all causes, mid year population estimates, and self reported general health status, based on data aggregated over a three year period [1].Female healthy life expectancy at age 65 is 2.3 years lower in Oldham compared to England and 1.8 years lower compared to the North West. Oldham has experienced decreasing healthy life expectancy for females for the previous two data periods, whereas there have been increases regionally and nationally. Oldham's rate is 2nd lowest across Greater Manchester and 7th lowest amongst CIPFA nearest neighbours.
Figure 8: Female healthy life expectancy at 65 trend
 Source: ONS
Figure 9: Female healthy life expectancy at 65 across Greater Manchester
 Source: ONS
Figure 10: Female healthy life expectancy at 65 across CIPFA nearest neighbours
 Source: ONS
Male healthy life expectancy at age 65 is 2.8 years lower in Oldham compared to England and 2.1 years lower compared to the North West. Similar to the female trend, Oldham has experienced decreasing healthy life expectancy for males for the previous two data periods, whereas there have been increases regionally and nationally. Oldham's rate is 2nd lowest across Greater Manchester and 2nd lowest amongst CIPFA nearest neighbours.
Figure 11: Male healthy life expectancy at 65 trend
 Source: ONS
Figure 12: Male healthy life expectancy at 65 across Greater Manchester
 Source: ONS
Figure 13: Male healthy life expectancy at 65 across CIPFA nearest neighbours
 Source: ONS
Female healthy life expectancy at 65 in Oldham is 9 years, higher than for males at 7.7 years. Oldham's inequality in healthy life expectancy at 65 between males and females is 1.3 years. This is greater than the difference at national (0.8 years), regional (1.0 years) and Greater Manchester level (0.9 years).
Figure 14: Healthy life expectancy at 65 by sex
 Source: ONS
Disability-Free Life Expectancy at 65
Disability free life expectancy (DFLE) at 65 is an estimate of the number of years a person aged 65 years would expect to live without a long lasting physical or mental health condition or disability limiting their ability to carry out day to day activities. This is based on contemporary mortality rates and prevalence of self-reported disability free state.The prevalence of disability free state is derived from responses to a survey question on general health. For a particular area and time period, it is an estimate of the average number of years a person aged 65 years would live without disability if he or she experienced the age specific mortality rates and prevalence of disability free state for that area and time period throughout his or her remaining life. Figures are calculated from deaths from all causes, mid year population estimates, and self reported disability free state, based on data aggregated over a three year period.
DFLE at age 65 years is an important summary measure of health and has implications for: quality of life; fitness for work given increases in the State Pension age; personal finances; social connections and contributions; health and care services; and the wider economy [1].
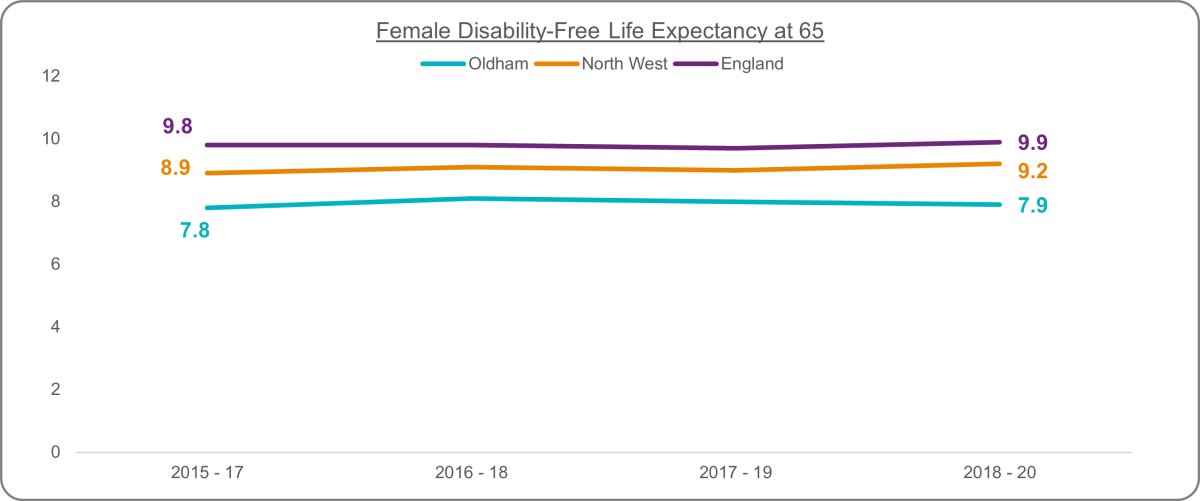
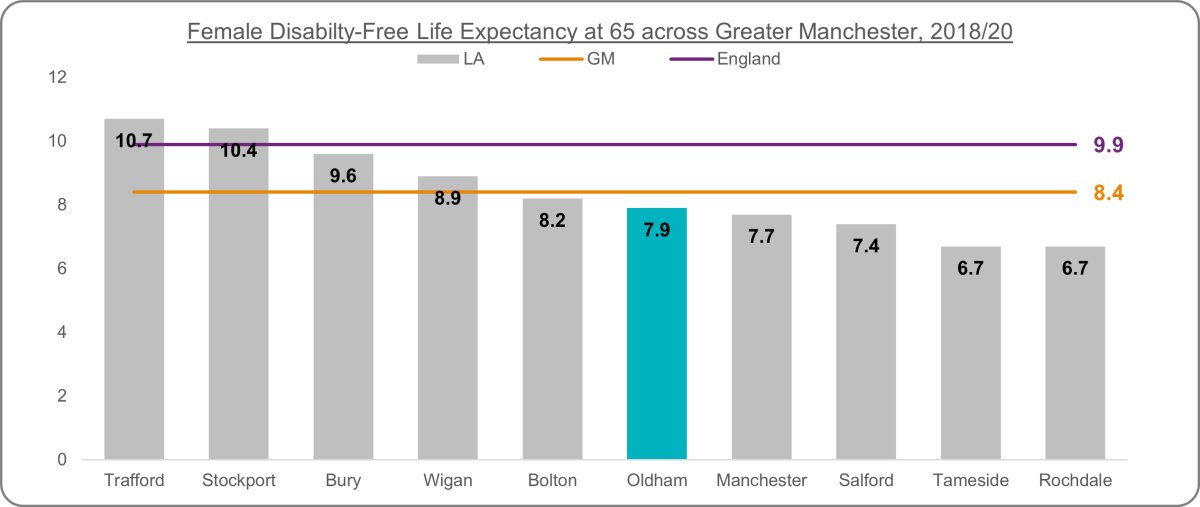
Oldham's latest female disability-free life expectancy figure is 7.9 years. This is 1.3 years lower than the North West average and 2 years lower than the England average. Between 2015-17 and 2018-20, rates remained relatively unchanged across Oldham, the North West and England. Oldham's latest rate ranks 5th lowest across Greater Manchester and 8th lowest across CIPFA nearest neighbours.
Figure 15: Female disability-free life expectancy at 65 trend
 source: ONS
Figure 16: Female disability-free life expectancy across Greater Manchester
 Source: ONS
Figure 17: Female disability-free life expectancy at 65 across CIPFA nearest neighbours
 Source: ONS
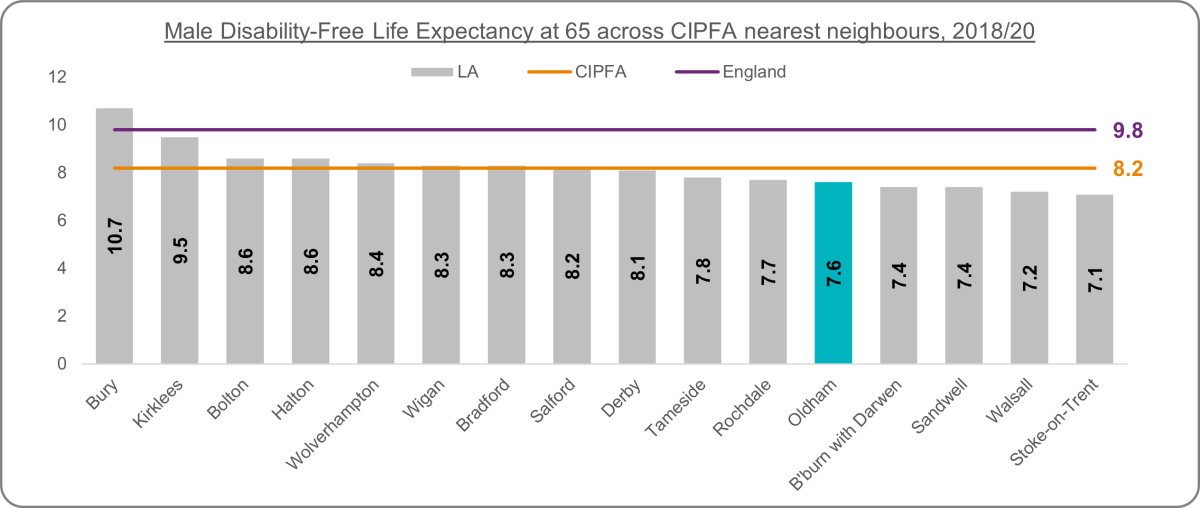
Oldham's latest male disability-free life expectancy figure is 7.6 years. This is 1.6 years lower than the North West average and 2.2 years lower than the England average. Between 2015-17 and 2018-20, rates remained relatively unchanged for the North West and England whereas rates decreased slightly for Oldham. Oldham's latest rate ranks 2nd lowest across Greater Manchester and 5th lowest across CIPFA nearest neighbours.
Figure 18: Male disability-free life expectancy at 65 trend
 Source: ONS
Figure 19: Male disability-free life expectancy at 65 across Greater Manchester
 Source: ONS
Figure 20: Male disability-free life expectancy at 65 across CIPFA nearest neighbours
 Source: ONS
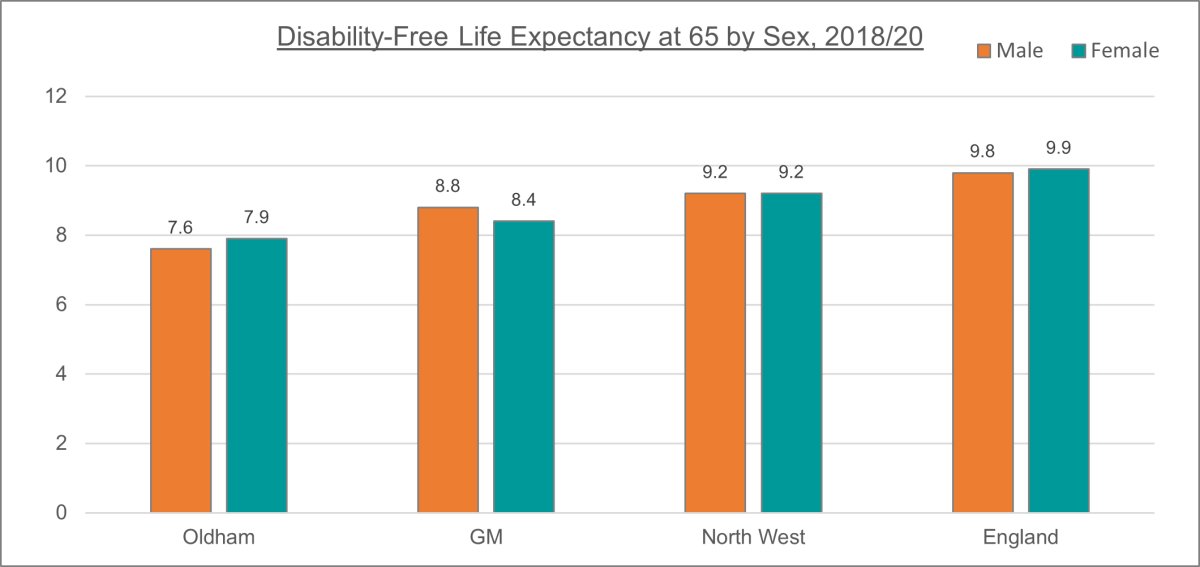
Oldham's disability-free life expectancy is 0.3 years higher for females than for males. Across the North West, the female rate is equal to the male rate and nationally the rate is 0.1 years higher for females compared to males. Greater Manchester sees the male rate exceed the female rate by 0.4 years.
Figure 21: Disability-free life expectancy at 65 by sex
 Source: ONS
Further Information & Resources
OHID Data ProfilesOHID Productive Healthy Ageing Data Profile
WHO Report on Ageing & Health
The World report on ageing and health outlines a framework for action to foster Healthy Ageing built around the new concept of functional ability. Making these investments will have valuable social and economic returns, both in terms of health and wellbeing of older people and in enabling their on-going participation in society.