Loading...


Diabetes
Introduction
Diabetes mellitus is one of the common endocrine diseases affecting all age groups with over three million people in the UK having the condition. Effective control and monitoring can reduce mortality and morbidity. Much of the management and monitoring of diabetic patients, particularly patients with Type 2 diabetes is undertaken by the GP and members of the primary care team. Much of the management and monitoring of diabetic patients is undertaken by the GP and members of the primary care team. However, type 1 and type 2 diabetes have different risk factors and management. There are differences in the population with type 1 and type 2 diabetes, leading to a discrepancy in receiving care processes and achieving treatment targets. Understanding this discrepancy at a local level is important for assessing the needs of the local population with diabetes and where improvements can be made [1].Type 2 diabetes is far more common than type 1. In the UK, over 90% of all adults with diabetes have type 2.There are 2 main types of diabetes:
Type 1 diabetes – a lifelong condition where the body's immune system attacks and destroys the cells that produce insulin
Type 2 diabetes – where the body does not produce enough insulin, or the body's cells do not react to insulin properly [2].
Data Overview
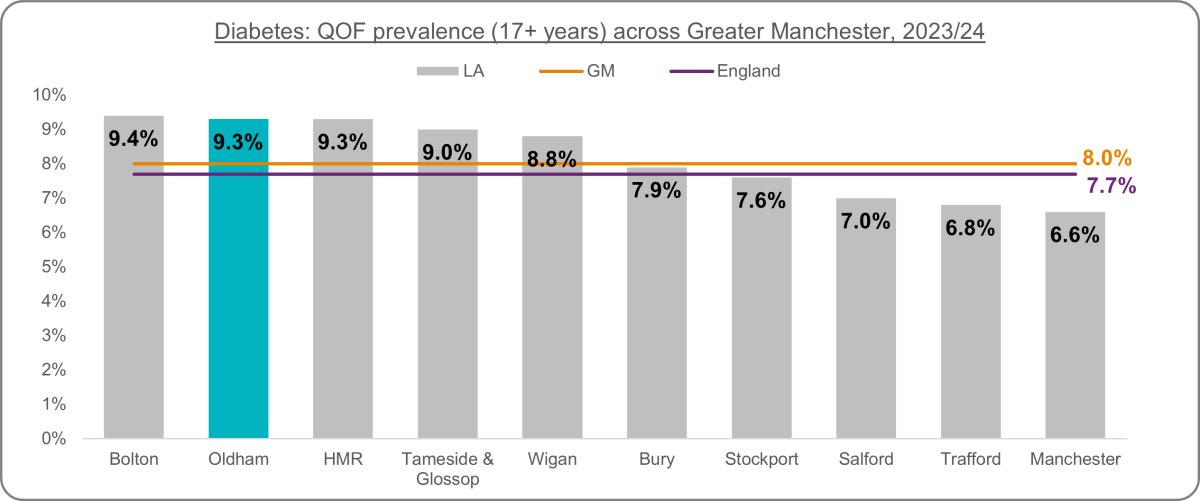
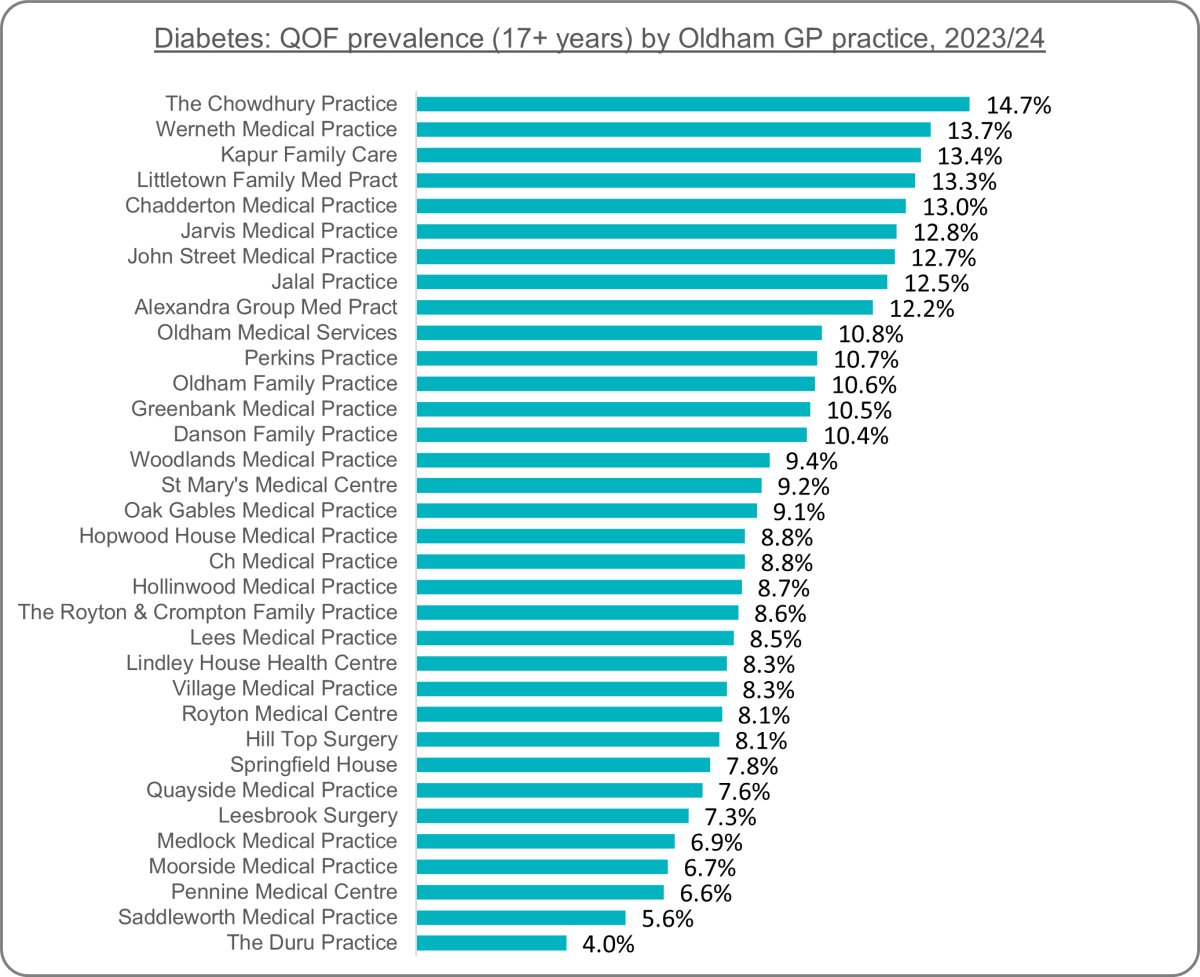
The following data represents the percentage of patients aged 17 or over with diabetes mellitus, as recorded on practice disease registers. Latest data shows that there are 19,344 people in Oldham living with diabetes. This equates to 9.3% of the population, higher than the North West average of 7.8% and the national rate of 7.7%. Rates are on the increase regionally and nationally as well as in Oldham, however Oldham's rate is increasing at a faster rate. Between 2012/13 and 2023/24, Oldham's rate increased by 39%, with the North West seeing an increase of 24% and the England average increasing by 28%. This indicates the inequality gap between Oldham and England is worsening. Oldham has the 2nd highest rate across Greater Manchester. Rates vary drastically across GP practices, with The Chowdhury Practice's rate of 14.7% more than three times higher than The Duru Practice of 4%.Figure 1: Diabetes QOF prevalence (17+ years) trend
 Source: NHS England
Figure 2: Diabetes QOF prevalence (17+ years) across Greater Manchester
 Source: NHS England
Figure 3: Diabetes QOF prevalence (17+ years) by Oldham GP Practice
 Source: NHS England
Further Information
NHS Diabetes InformationAdvice and information relating to Diabetes
World Health Organisation Diabetes Fact Sheet
WHO information, facts and figures relating to Diabetes
OHID Data Profiles
OHID data profiles for Cardiovascular Disease with additional data and information
References
[1] OHID Data Profiles, https://fingertips.phe.org.uk/profile/cardiovascular/data#page/6/gid/1938133107/pat/221/par/nE54000057/ati/66/are/nE38000135/iid/241/age/187/sex/4/cat/-1/ctp/-1/yrr/1/cid/4/tbm/1/page-options/car-do-0, accessed January 2025[2] NHS Diabetes Information, https://www.nhs.uk/conditions/diabetes/, accessed January 2025
....