Loading...

Physical activity
Introduction
Physical inactivity is the 4th leading risk factor for global mortality accounting for 6% of deaths globally. People who have a physically active lifestyle have a 20 to 35% lower risk of cardiovascular disease, coronary heart disease and stroke compared to those who have a sedentary lifestyle. Regular physical activity is also associated with a reduced risk of diabetes, obesity, osteoporosis, colon and breast cancer, and with improved mental health. In older adults physical activity is associated with increased functional capacities. The estimated direct cost of physical inactivity to the NHS across the UK is over £0.9 billion per year [1].Despite the widely reported benefits of physical activity, most adults across the UK are insufficiently active to meet the full set of recommendations set out in the Chief Medical Officer's guidelines on physical activity. The guidelines state that:
Adults (19 to 64 years)
• For good physical and mental health, adults should aim to be physically active every day. Any activity is better than none, and more is better still.
• Adults should do activities to develop or maintain strength in the major muscle groups. These could include heavy gardening, carrying heavy shopping, or resistance exercise. Muscle strengthening activities should be done on at least two days a week, but any strengthening activity is better than none.
• Each week, adults should accumulate at least 150 minutes (2 1/2 hours) of moderate intensity activity (such as brisk walking or cycling); or 75 minutes of vigorous intensity activity (such as running); or even shorter durations of very vigorous intensity activity (such as sprinting or stair climbing); or a combination of moderate, vigorous and very vigorous intensity activity.
• Adults should aim to minimise the amount of time spent being sedentary, and when physically possible should break up long periods of inactivity with at least light physical activity.
Older Adults (65 years and over)
• Older adults should participate in daily physical activity to gain health benefits, including maintenance of good physical and mental health, wellbeing, and social functioning. Some physical activity is better than none: even light activity brings some health benefits compared to being sedentary, while more daily physical activity provides greater health and social benefits.
• Older adults should maintain or improve their physical function by undertaking activities aimed at improving or maintaining muscle strength, balance and flexibility on at least two days a week. These could be combined with sessions involving moderate aerobic activity or could be additional sessions aimed specifically at these components of fitness.
• Each week older adults should aim to accumulate 150 minutes (two and a half hours) of moderate intensity aerobic activity, building up gradually from current levels. Those who are already regularly active can achieve these benefits through 75 minutes of vigorous intensity activity, or a combination of moderate and vigorous activity, to achieve greater benefits. Weight-bearing activities which create an impact through the body help to maintain bone health.
• Older adults should break up prolonged periods of being sedentary with light activity when physically possible, or at least with standing, as this has distinct health benefits for older people.
The below infographic summarises the recommendations alongside some of the reduced risks and benefits of physical activity.
Figure 1: UK Chief Medical Officer's physical activity guidelines 2019

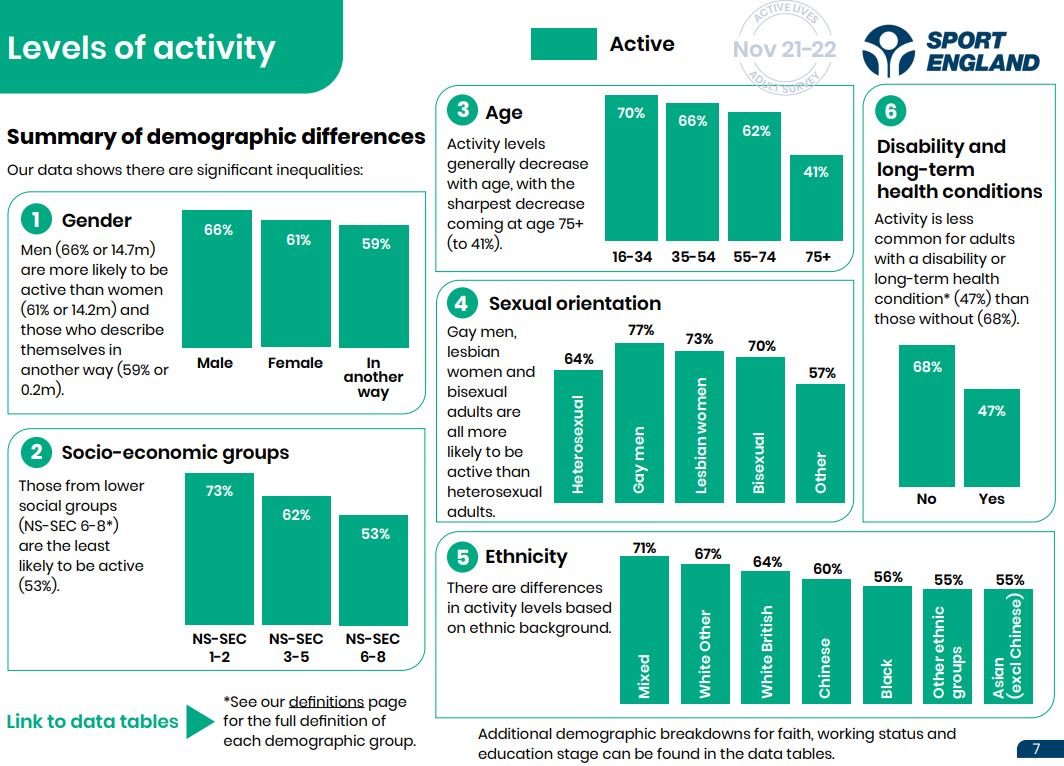
The latest Active Lives Adult Survey shows significant inequalities between demographic groups across England in terms of gender, socio-economic groups, age, sexual orientation, ethnicity and those with a disability or long-term conditions. Compared to England averages, Oldham has a higher number of people from ethnic minority backgrounds, higher numbers of residents belonging to lower socio-economic groups and a higher proportion of people with a disability or long-term condition, so these findings are particularly important when assessing and analysing physical activity levels in the borough.
Figure 2: Sport England Active Lives Adult Survey demographic summary findings
Data Overview
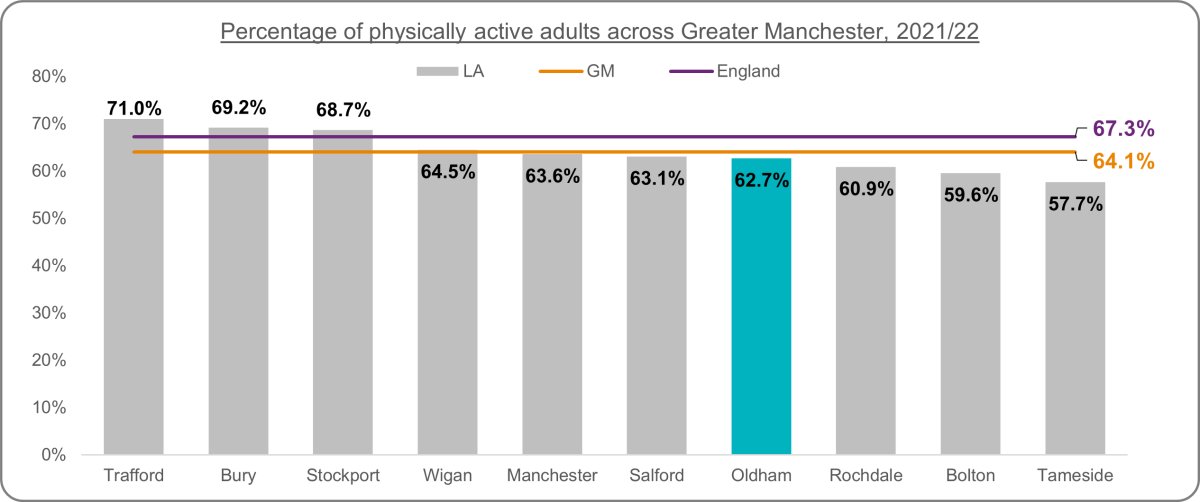
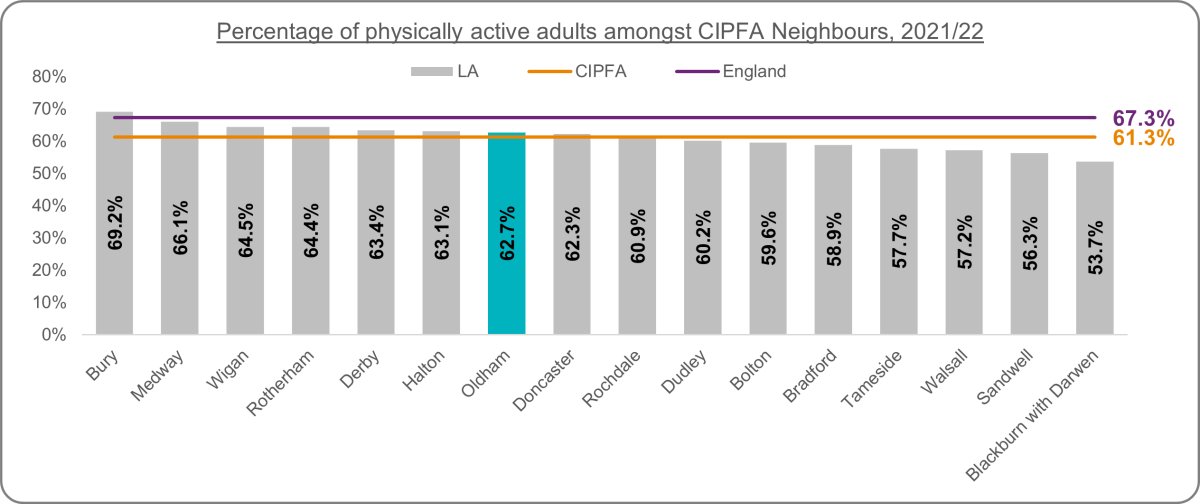
The percentage of physically active adults is derived from the Sport England Active Lives Adult survey and relates to the number of respondents aged 19 and over doing at least 150 moderate intensity equivalent minutes physical activity per week in bouts of 10 minutes or more in the previous 28 days.The percentage of physically active adults has remained relatively stable throughout the period shown for England and the North West. Oldham's rate decreased between 2016/17 and 2020/21 but latest data reveals a similar percentage to 2015/16 data. Oldham's latest data reveals a lower percentage of physically active adults (62.7%) compared to the North West (65.2%) and England (67.3%). Oldham's rate has been below regional and national averages since 2015/16. In 2021/22, Oldham ranked averagely against comparators. Oldham had the 4th lowest rate across Greater Manchester and 7th highest amongst CIPFA neighbours.
Figure 3: Percentage of physically active adults trend
 Source: Office for Health Improvement and Disparities (based on the Active Lives Adult Survey, Sport England)
Figure 4: Percentage of physically active adults across Greater Manchester
 Source: Office for Health Improvement and Disparities (based on the Active Lives Adult Survey, Sport England)
Figure 5: Percentage of physically active adults across CIPFA neighbours
 Source: Office for Health Improvement and Disparities (based on the Active Lives Adult Survey, Sport England)
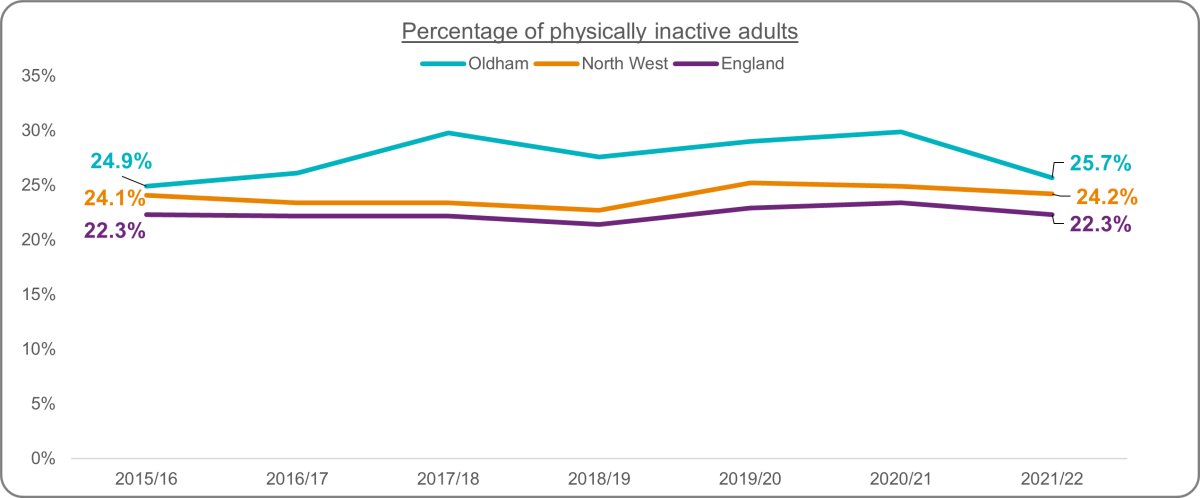
Physically inactive adults are defined as the number of respondents aged 19 and over doing less than 30 moderate intensity equivalent minutes physical activity per week in bouts of 10 minutes or more in the previous 28 days. The percentage of adults classified as physically inactive has remained stable across Oldham, the North West and England throughout the period shown. Latest figures (2021/22) show Oldham's rate of 25.7% to be higher than the regional rate of 24.2% and the national rate of 22.3%. Oldham is 5th lowest across GM and 6th lowest amongst CIPFA neighbours.
Figure 6: Percentage of physically inactive adults trend
 Source: Office for Health Improvement and Disparities (based on the Active Lives Adult Survey, Sport England)
Figure 7: Percentage of physically inactive adults across Greater Manchester
 Source: Office for Health Improvement and Disparities (based on the Active Lives Adult Survey, Sport England)
Figure 8: Percentage of physically inactive adults across CIPFA neighbours
 Source: Office for Health Improvement and Disparities (based on the Active Lives Adult Survey, Sport England)
Creating an environment where people actively choose to walk and cycle as part of everyday life can have a significant impact on public health and may reduce inequalities in health. It is an essential component of a strategic approach to increasing physical activity and may be more cost-effective than other initiatives that promote exercise, sport and active leisure pursuits.
More walking and cycling also has the potential to achieve related policy objectives:
•supports local businesses and promotes vibrant town centres
•provides a high-quality, appealing public realm
•reduces car travel, air pollution, carbon dioxide emissions and congestion
•reduces road danger and noise
•increases the number of people of all ages out on the streets, making public spaces seem more welcoming and providing opportunities for social interaction and children’s play
•provides an opportunity for everyone, including people with impairments, to experience and enjoy the outdoor environment.
Public Health England has a stated aim to support work across government on sustainable travel to promote increased levels of physical activity through walking and cycling and contribute to the implementation of the government’s sports strategy[1].
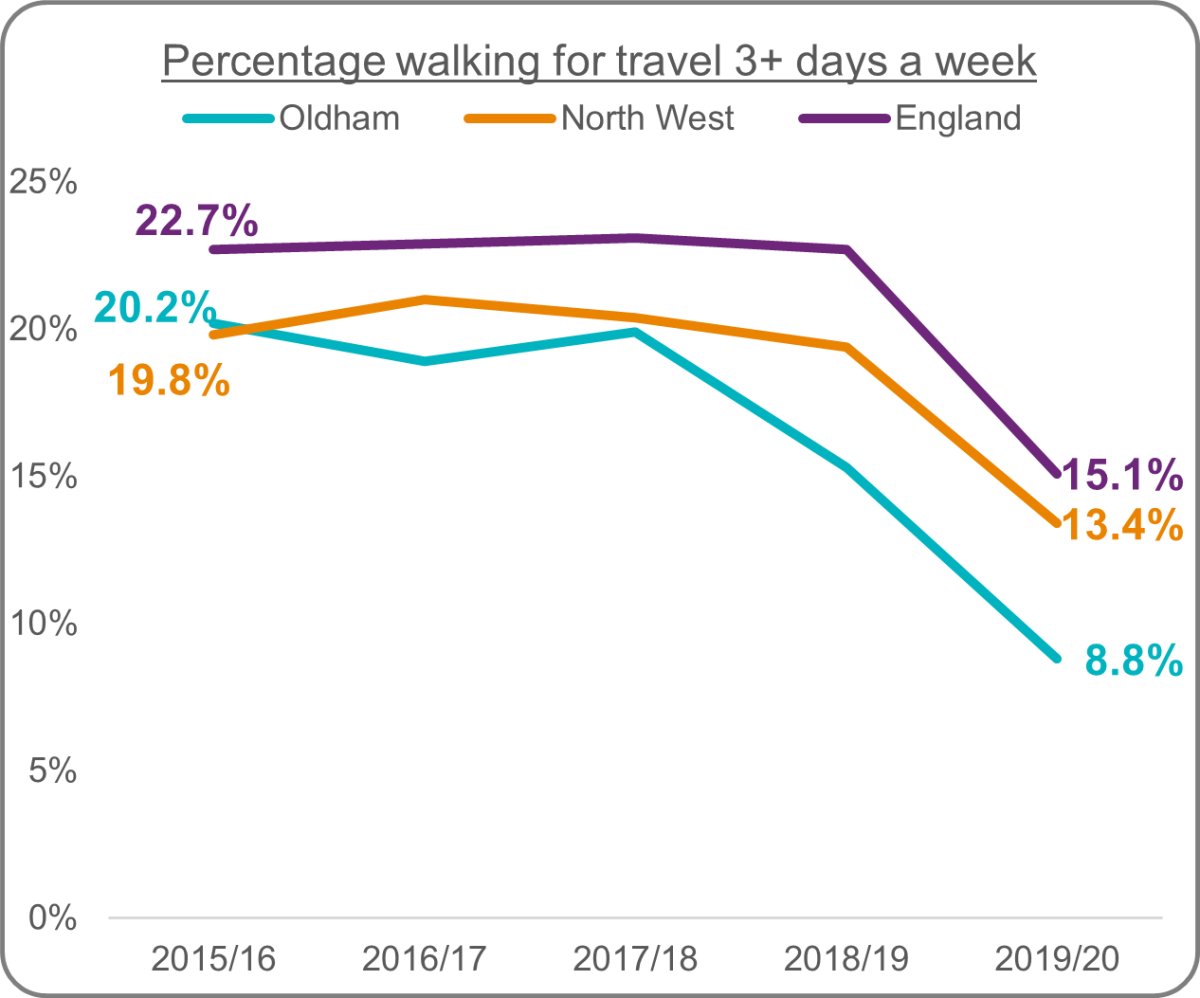
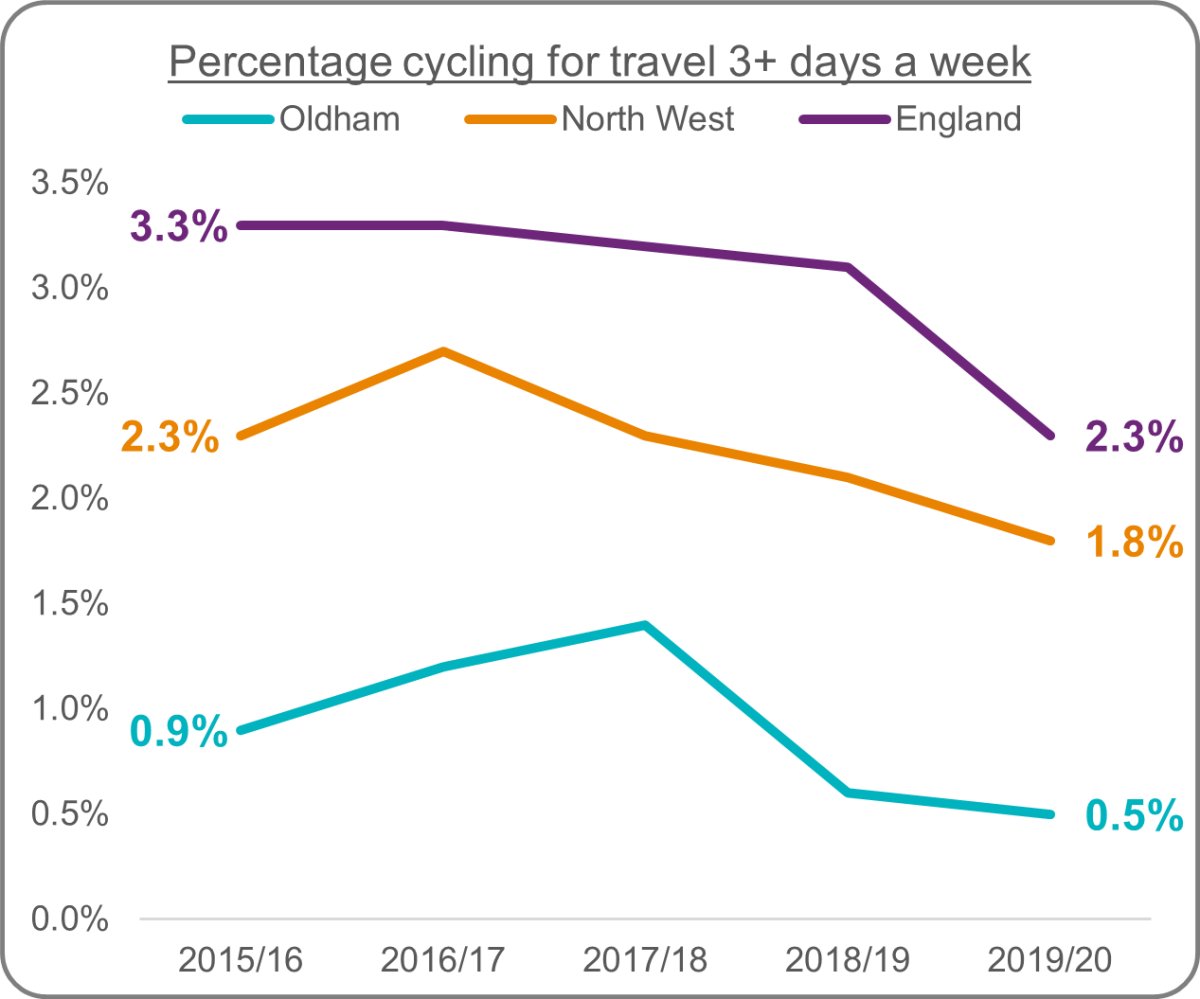
The percentage of people walking for travel on at least 3 days per week has decreased between 2015/16 and 2019/20 across Oldham, the North West and England. Oldham's rate of 8.8% is lower than the regional average of 13.4% and the national average of 15.1%. Similarly, the percentage of people cycling for travel on at least 3 days per week has also decreased in Oldham, regionally and nationally. Oldham's rate of 0.5% is significantly lower than the North West average of 1.8% and the national average of 2.3%.
Figures 9 & 10: Percentage walking and cycling for travel at least 3 days per week trend
 Source: Office for Health Improvement and Disparities (based on the Active Lives Adult Survey, Sport England)
Further Information & Resources
Active Lives Adult Survey November 2021-22 ReportThis report presents data from the Active Lives Adult Survey for the period mid-November 2021 to mid-November 2022. Data is presented for adults aged 16+ in England.
UK Chief Medical Officer's Physical Activity Guideline Infographic
Infographic to help health professionals explain the type and amount of physical activity that adults and older adults should be doing to improve their health. . This is a pdf version of figure 1 presented in the introduction section above.
UK Chief Medical Officers' Physical Activity Guidelines
This report presents an update to the 2011 physical activity guidelines issued by the four Chief Medical Officers (CMOs) of England, Scotland, Wales and Northern Ireland. The UK CMOs draw upon global evidence to present guidelines for different age groups, covering the volume, duration, frequency and type of physical activity required across the life course to achieve health benefits.
UK Chief Medical Officer's physical activity guidelines communications framework: main guidance
The communications framework will primarily assist the UK and devolved government administrations, public health agencies and partners to adopt a consistent and collaborative approach to support the dissemination and implementation of national key messages that promote and raise awareness of the UK CMOs’ physical activity guidelines. March 2023.
OHID Physical Activity Data Profile
Additional data and information relating to physical activity